Understanding Absolute and Relative Risk in Medical Articles
A “50% reduction” needs a starting risk and a timeframe. Two clearly labeled hypothetical examples show how absolute and relative measures fit together—and where wording can mislead.
Quick answer
Absolute risk describes the event probability in a group over a specified period. Absolute risk reduction subtracts the intervention risk from the comparison risk; relative risk divides those risks. In a hypothetical change from 4% to 2%, the absolute reduction is 2 percentage points and the relative reduction is 50%. Both need context and uncertainty.
Have a draft that needs a clinical review? Request a Review Quote ↗
Absolute and relative risk can describe the same result while leaving readers with very different impressions. A medical article should make the comparison understandable—not leave the most important arithmetic to the person reading it.
“A 50% reduction.” It is the kind of phrase that can carry a headline by itself. But 50% of what starting risk? For which outcome? Over how long?
Until those questions are answered, the number has arrived without its meaning.
The examples below are invented to explain the arithmetic. They do not describe an actual medicine, study, patient, or treatment recommendation. Assume equal-sized groups, complete follow-up, and a defined event counted once per person over one year.
Start with the event risk in each group
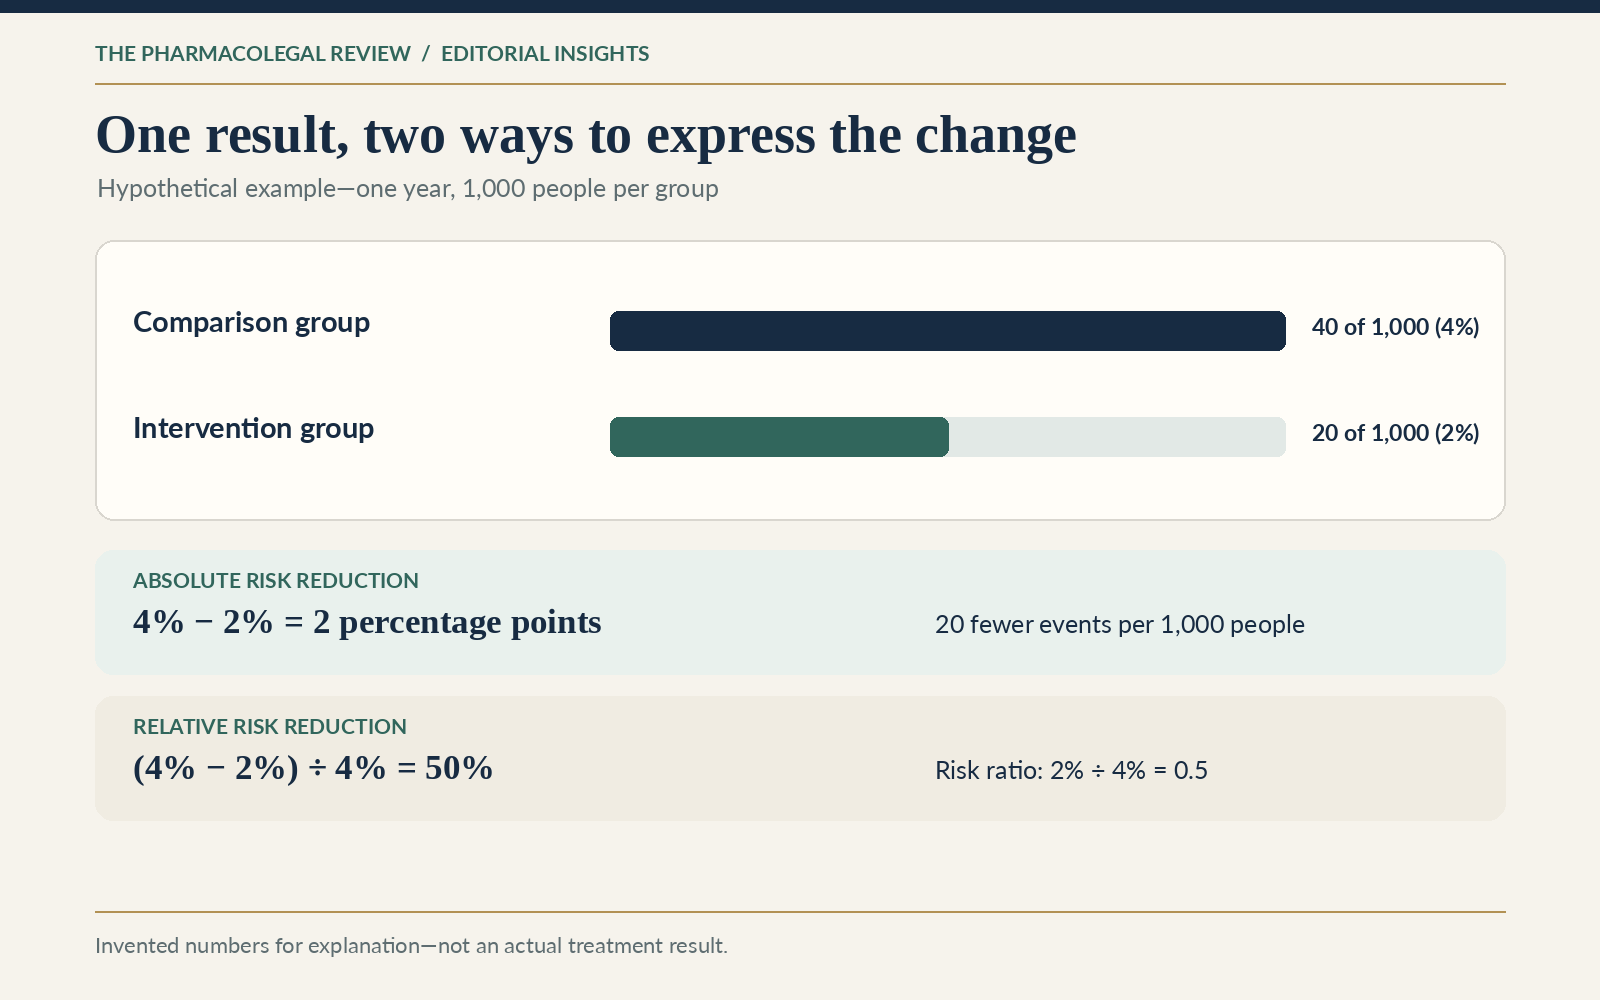
In our hypothetical comparison, 40 of 1,000 people in the comparison group experience the event over one year. That is a risk of 4%. In the intervention group, 20 of 1,000 experience it over the same period: a risk of 2%.
Those two group risks are the starting information. They tell us the outcome frequency in each group before we choose a way to describe the difference.
The group size, event definition, and timeframe matter. If one figure refers to a different outcome or period, placing the percentages side by side can create a comparison the source does not support.
For a real article, verify the figures and the analysis used in the original source. The simplified calculation here is not a substitute for interpreting a study’s methods.
Absolute risk reduction: the difference between the risks
For this example, subtract the intervention-group risk from the comparison-group risk:
4% − 2% = 2 percentage points.
This is an absolute risk reduction of 2 percentage points, equivalent to 20 fewer people experiencing the event per 1,000 people over one year in the hypothetical comparison.
“Percentage points” helps distinguish the difference between two percentages from a relative percentage change. Calling this simply “a 2% reduction” leaves room for misunderstanding.
Cochrane’s guidance distinguishes relative and absolute presentations and emphasizes the role of the comparison-group risk and timeframe when interpreting absolute effects.[1]
Relative risk and relative risk reduction: the proportional comparison
The risk ratio divides the intervention-group risk by the comparison-group risk:
2% ÷ 4% = 0.5.
For this hypothetical example, the intervention-group risk is half the comparison-group risk. The relative risk reduction is:
(4% − 2%) ÷ 4% = 50%.
The 50% relative reduction and the 2-percentage-point absolute reduction are two descriptions of the same invented comparison. They are not competing results.
Cochrane describes risk ratios and risk differences as distinct effect measures.[2] Preserve the measure the source actually reports. An odds ratio or hazard ratio should not be casually relabeled as a risk ratio or turned into an absolute probability without the necessary information and methods.
The same relative reduction can accompany a different absolute change
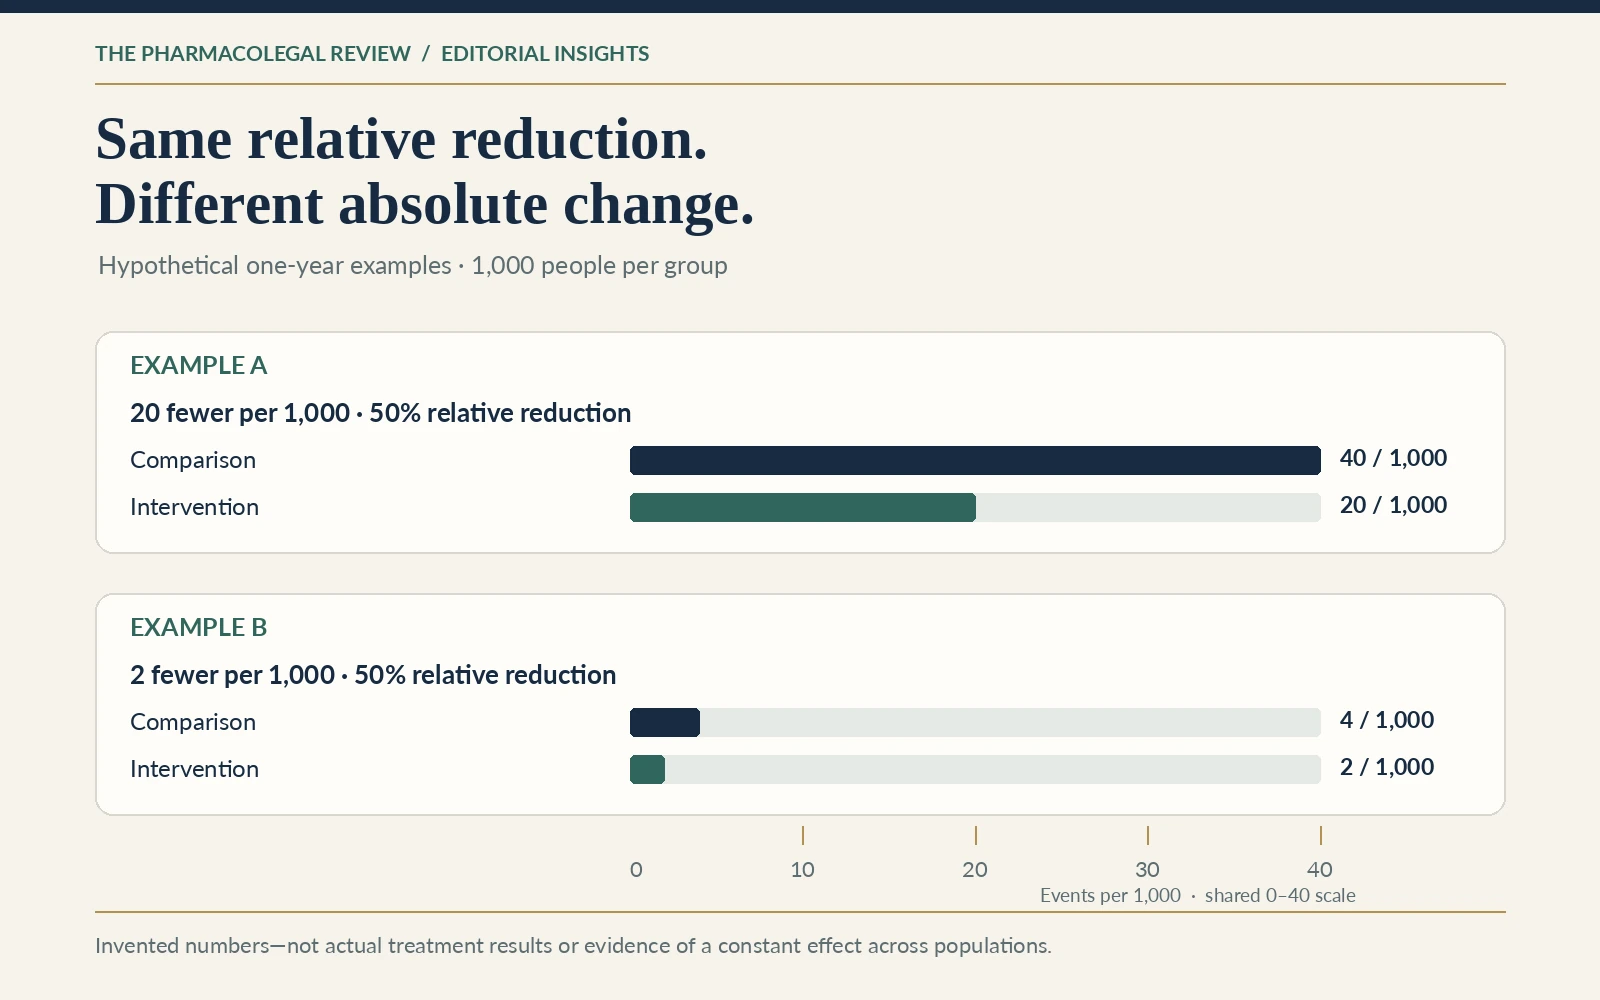
Now consider a second invented comparison over one year. The comparison-group risk is 4 of 1,000, or 0.4%; the intervention-group risk is 2 of 1,000, or 0.2%.
The relative reduction is again 50%. The absolute reduction is now 0.2 percentage points, or 2 fewer events per 1,000 people.
- Example A: 40 to 20 per 1,000; absolute reduction 20 per 1,000; relative reduction 50%.
- Example B: 4 to 2 per 1,000; absolute reduction 2 per 1,000; relative reduction 50%.
These are separate arithmetic examples, not evidence that a real intervention produces a constant relative effect across populations. Whether an effect applies to another group requires assessment.
The editorial lesson is simple: a relative percentage alone does not tell the reader the size of the absolute difference.
Do the explanatory work for the reader
A reader should not need to reconstruct the denominator or calculate the comparison to understand the main message. CDC’s Clear Communication Index recommends doing necessary calculations for the audience and explaining what the numbers mean.[3]
A clearer sentence for Example A would be: “In this hypothetical one-year comparison, the event occurred in 40 of 1,000 people in the comparison group and 20 of 1,000 in the intervention group—a difference of 20 per 1,000, or 2 percentage points.”
If the relative reduction is relevant, add it with its label. Do not make the absolute information difficult to find while the largest-looking percentage gets the headline.
For patients, the explanation may need familiar language and a simple visual. For clinicians, the article may need more methodological detail. The basic obligation to identify the measure and context remains. See how audience changes medical writing.
Keep uncertainty and clinical meaning in the picture
The arithmetic examples do not include confidence intervals, study limitations, competing outcomes, or an assessment of clinical importance. A real medical article needs the relevant uncertainty and context from the source.
A point estimate does not describe its precision by itself. Nor does a risk reduction automatically tell the reader how important the outcome is, what harms or burdens accompany the intervention, or whether the evidence applies to them.
A visually impressive percentage should not become an individualized promise. A group result is not a prediction that any particular person will benefit.
When drafting, identify what is known, what the analysis estimates, and which qualifications materially affect interpretation. Clear patient education preserves that meaning rather than editing it away.
A practical check before the numbers reach publication
Review the numerical claim wherever it appears: headline, summary, body, chart, caption, and social excerpt.
- Outcome: is the same event being described throughout?
- Comparison: are the groups and reference risk clear?
- Time: is the follow-up period stated?
- Measure: are risk ratio, relative reduction, and absolute difference labeled correctly?
- Arithmetic: do conversions and denominators agree with the source?
- Interpretation: are precision, limitations, and applicability represented appropriately?
The reference-checking guide explains how to connect the wording to its supporting material. Clinical content review can be scoped to assess these claims, flag inconsistencies, and identify when statistical expertise is needed.
Frequently asked questions
Does a 50% relative risk reduction mean 50 fewer people out of 100?
No. It means the risk is reduced by half relative to the comparison risk. In Example A, the risks are 4% and 2%, giving an absolute difference of 2 percentage points—not 50 percentage points.
Why say percentage points instead of percent?
Percentage points describe the difference between percentages. Moving from 4% to 2% is a decrease of 2 percentage points and a relative decrease of 50%. Labeling the measure helps prevent those statements from being confused.
Should every article show both absolute and relative risk?
Present the measures needed for an accurate explanation when the necessary information is available. Do not invent an absolute estimate if the source does not support it. Explain missing information and adapt the detail to the intended audience.
Can PCS review risk statements in an existing draft?
A project can include checking numerical claims, wording, and their support in supplied references. Define whether additional research or statistical review is required. See what a useful review report includes when specifying the output.
References
- Cochrane. Chapter 15: Interpreting Results and Drawing Conclusions. Cochrane Handbook for Systematic Reviews of Interventions.
- Cochrane. Chapter 6: Choosing Effect Measures and Computing Estimates of Effect. Cochrane Handbook for Systematic Reviews of Interventions.
- Centers for Disease Control and Prevention. Does the Audience Have to Conduct Mathematical Calculations?
Have a draft that needs a clinical review?
Get annotated feedback on medication accuracy, source support, and clinical context. Send your topic, deliverable, and deadline to start a proposal.
More from the Review
Scroll or swipe to explore related articles. When the article list is focused, use the left and right arrow keys; Home and End jump to the beginning and end.

What a Useful Clinical Review Report Should Include
Clinical feedback is useful when the next decision is clear. Explore the scope, evidence, findings, proposed actions, and handoff a practical review report should contain.
Read article : What a Useful Clinical Review Report Should Include
Medical Literature Research: What a Targeted Review Can—and Cannot—Answer
A focused search can serve a useful purpose without being comprehensive. Understand what targeted literature research can answer, how to describe its limits, and when broader work is needed.
Read article : Medical Literature Research: What a Targeted Review Can—and Cannot—Answer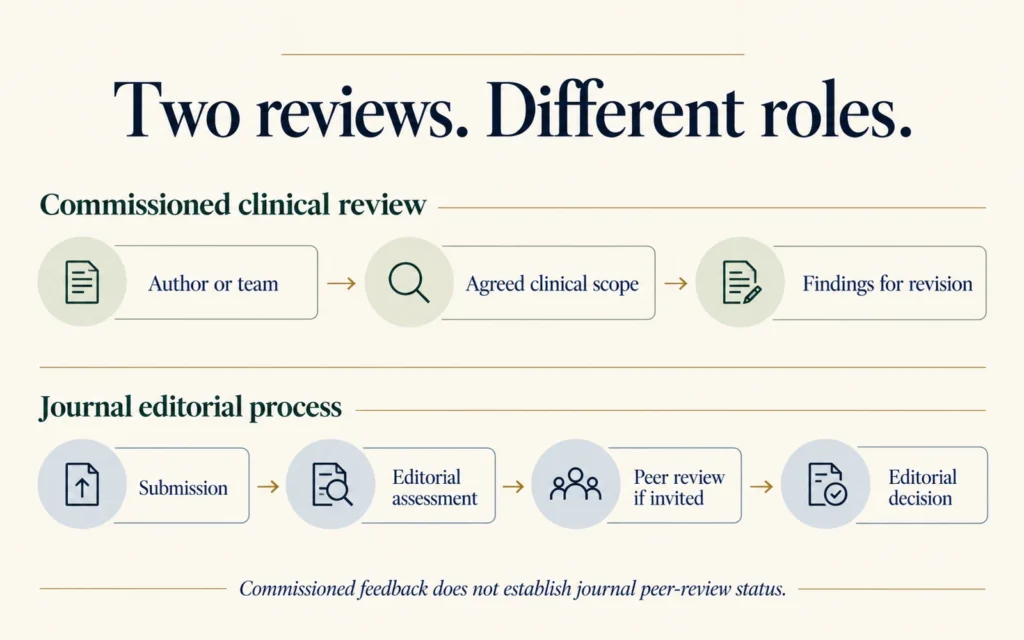
Clinical Manuscript Review vs. Journal Peer Review
A careful commissioned review can improve a manuscript without becoming journal peer review. Understand the roles, limits, and deliverables before choosing the service.
Read article : Clinical Manuscript Review vs. Journal Peer Review
Checking Medical References: Does the Source Support the Claim?
A citation can be relevant without supporting the sentence beside it. A practical guide to matching medical claims with evidence and leaving a useful editorial decision.
Read article : Checking Medical References: Does the Source Support the Claim?
Common Accuracy Problems in Medication Content
A polished medication article can still imply more than its evidence supports. Six practical review targets reveal where meaning can shift—and how to document a useful correction.
Read article : Common Accuracy Problems in Medication Content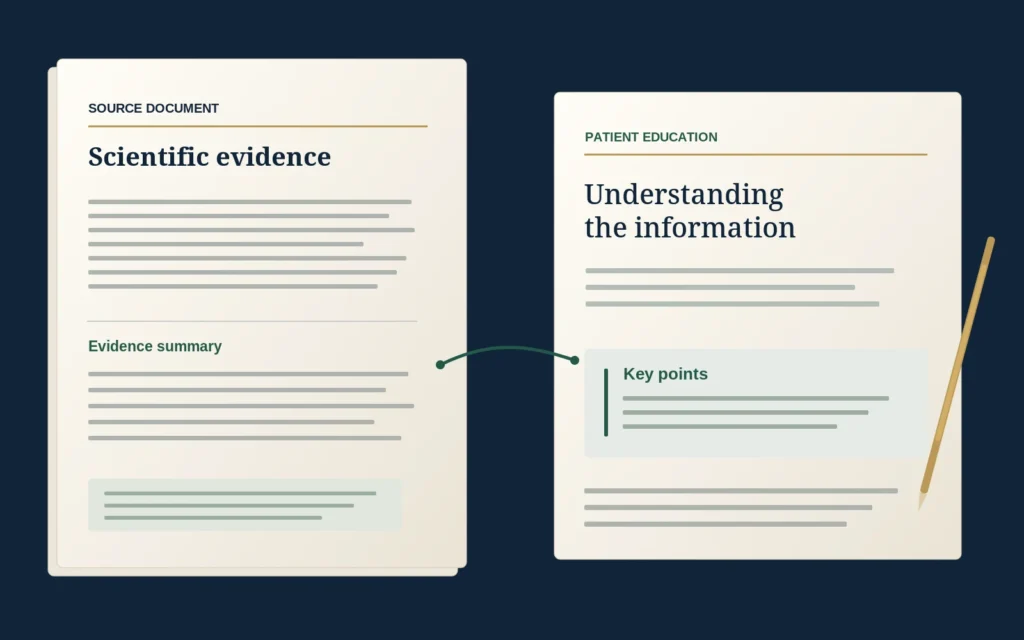
From Clinical Evidence to Clear Patient Education
Making clinical evidence easier to read is only the start. Explore how patient education can preserve qualifications, explain numbers, and serve a clear reader purpose.
Read article : From Clinical Evidence to Clear Patient Education